Debugging PowerShell Binary Modules in Visual Studio
So you've been tasked with creating a PowerShell binary module to expose functionality from a C# library you're working on, but don't know where to start in Visual Studio. Maybe you don't even like PowerShell and naively thought you could satisfy system administrators with a traditional .NET CLI instead of a real PowerShell module like they've been asking for. You've then asked around for advice and all you got is "use VSCode", but you want to stick to Visual Studio because it's what you know, and it feels more appropriate for everything except PowerShell.
Let's fix this the manual way for Powershell binary module development in Visual Studio, one manual step at a time, such that you can build and debug your PowerShell project like any other .NET project. This blog post covers both local and remote debugging of PowerShell binary modules, but doesn't cover PowerShell script debugging, which is another topic entirely.
Creating PowerShell Demo Project
Let's begin by creating a Visual Studio solution with a sample PowerShell binary module. Since absolute file paths are unfortunately required for many steps, I'll be using C:\Users\Public\Projects throughout this guide. Even if this isn't your regular project directory, I'd recommend using it temporarily before changing to something else:
$SolutionName = "PowerShellDemo"
$ProjectName = "SampleModule"
$SolutionDir = "C:\Users\Public\Projects\$SolutionName"
New-Item -Type Directory -Path $SolutionDir -ErrorAction SilentlyContinue
Set-Location $SolutionDir
Use the dotnet CLI to create the PowerShellDemo solution and SampleModule project:
dotnet new sln -n PowerShellDemo
dotnet new classlib -n SampleModule -f netstandard2.0
dotnet sln add SampleModule/SampleModule.csproj
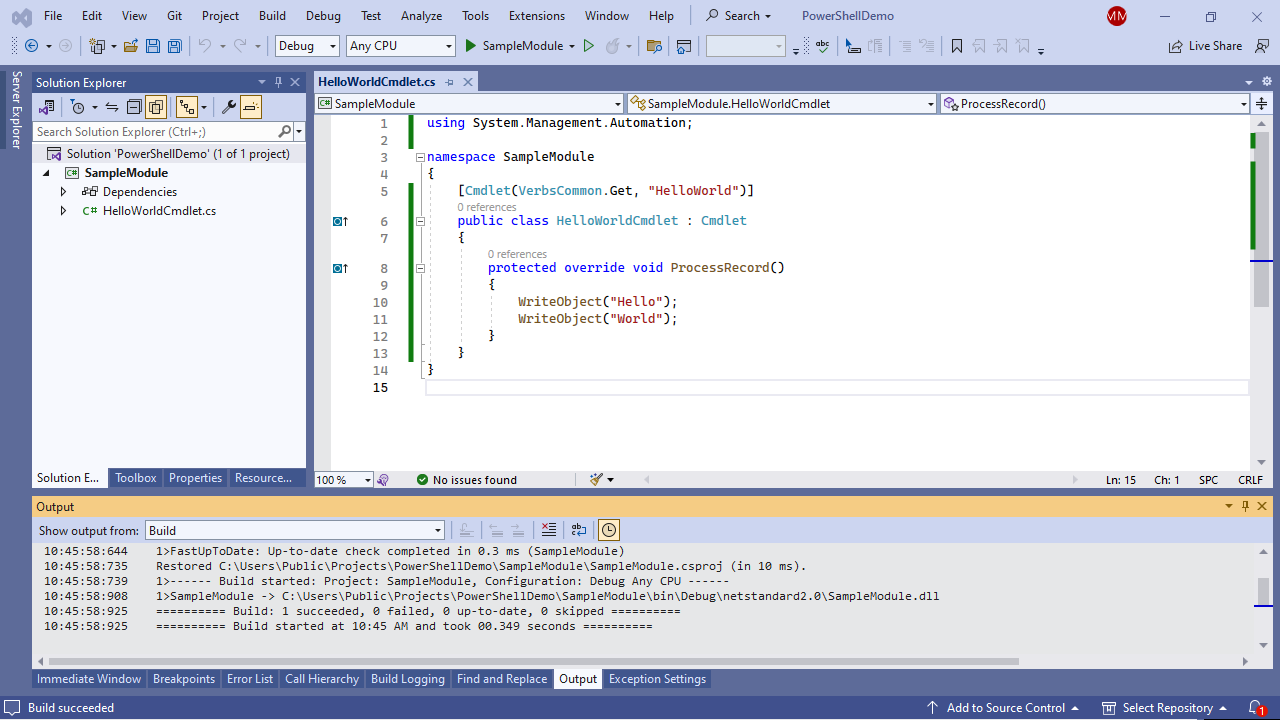
dotnet add SampleModule/SampleModule.csproj package PowerShellStandard.Library --version 5.1.1Open PowerShellDemo.sln in Visual Studio (start .\PowerShellDemo.sln), then rename Class1.cs to HelloWorldCmdlet.cs and replace its contents with the following code:
using System.Management.Automation;

namespace SampleModule
{
    [Cmdlet(VerbsCommon.Get, "HelloWorld")]
    public class HelloWorldCmdlet : Cmdlet
    {
        protected override void ProcessRecord()
        {
            WriteObject("Hello");
            WriteObject("World");
        }
    }
}
You can now build the solution (Ctrl+Shift+B):
But when you try to start the project in the debugger (F5), or even without it (Ctrl+F5), all you get is this lousy error message:
A project with an Output Type of Class Library cannot be started directly. In order to debug this project, add an executable project to this solution which references the library project. Set the executable project as the startup project.
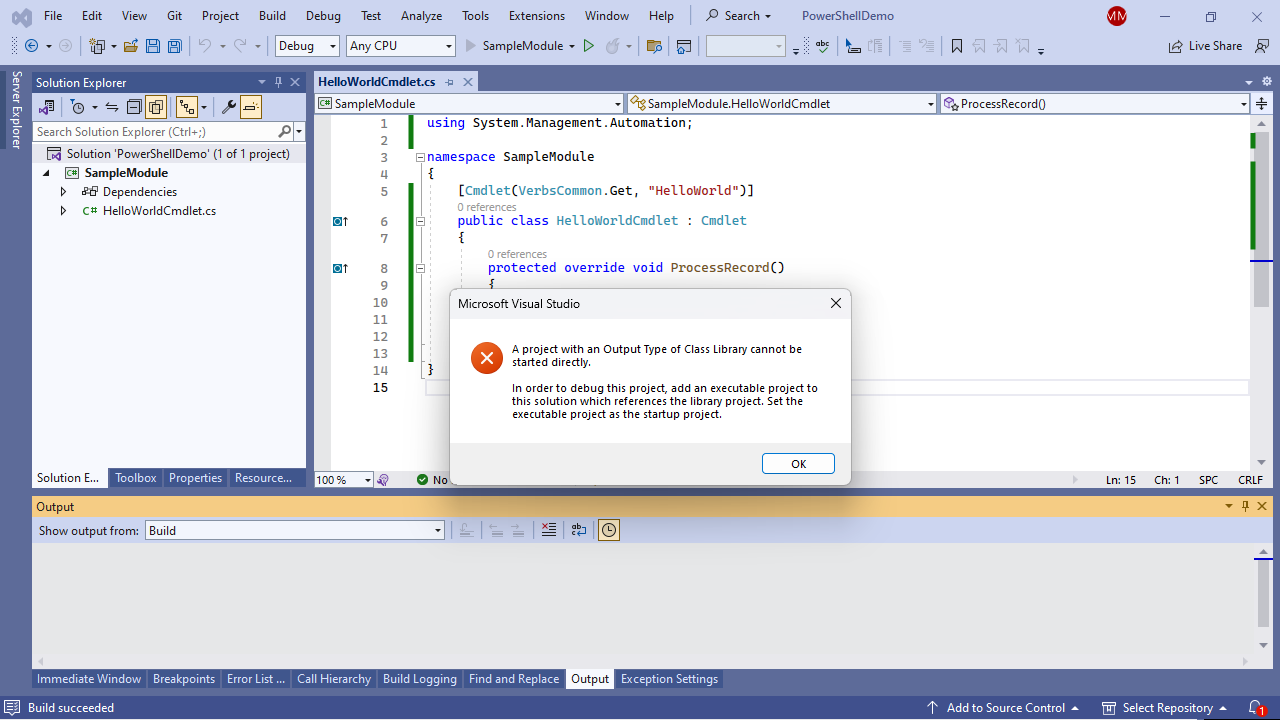
Well, that's not very helpful. How does one even run the Get-HelloWorld cmdlet manually?
- Look at the Visual Studio build logs to find the output file path for our binary module
- Open a fresh PowerShell terminal, call Import-Module on the binary module output file path
- Script a few useful things you want to call prior to your cmdlet of interest, then call it
- Close the PowerShell terminal to release file locks on the binary module output file path
From an interactive PowerShell terminal, this is what it looks like:
PS C:\> pwsh -NoLogo
PS C:\> Import-Module "C:\Users\Public\Projects\PowerShellDemo\SampleModule\bin\Debug\netstandard2.0\SampleModule.dll"
PS C:\> Get-Command -Module SampleModule

CommandType     Name                                               Version    Source
-----------     ----                                               -------    ------
Cmdlet          Get-HelloWorld                                     1.0.0.0    SampleModule

PS C:\> Get-HelloWorld
Hello
World
PS C:\> exit
If you try to rebuild the Visual Studio project without terminating all PowerShell processes that have the binary module loaded, you will encounter file locking problems:
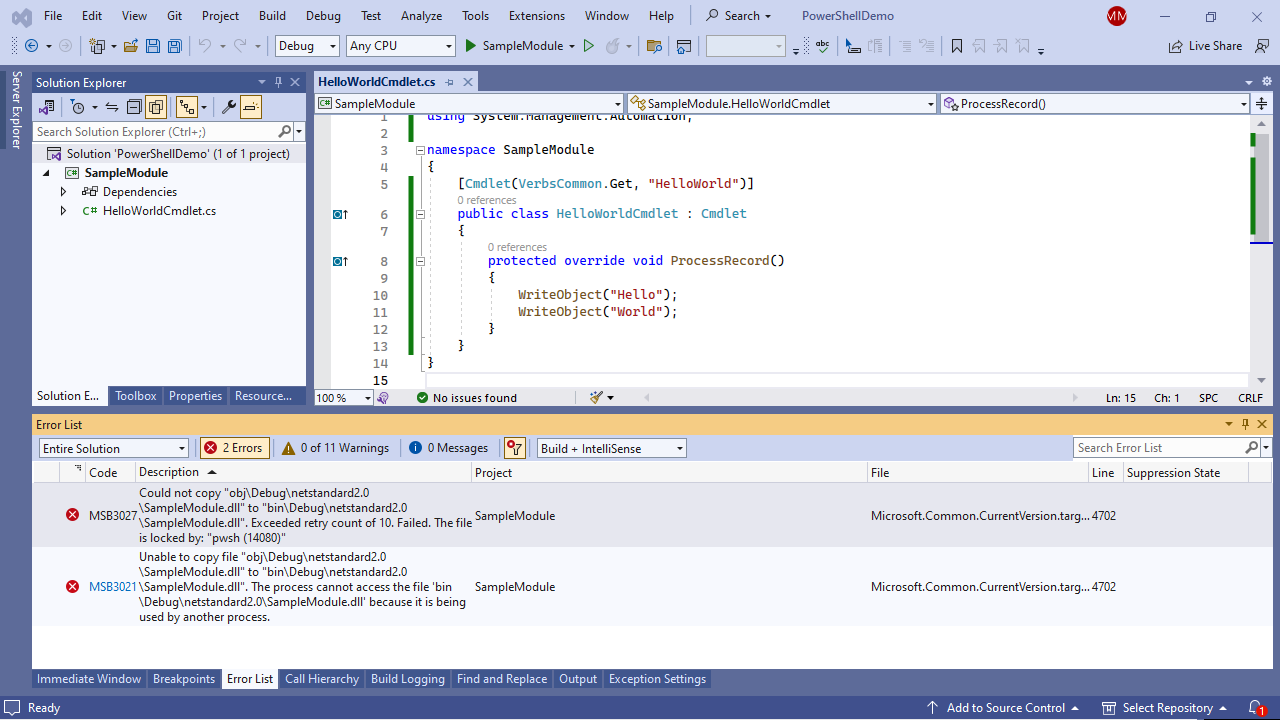
Launching a fresh pwsh.exe process inside an existing PowerShell terminal may look odd, but it makes it a lot easier to keep the same terminal window. The exit command terminates the child pwsh.exe process and returns control to the parent PowerShell terminal.
Creating PowerShell Launcher Project
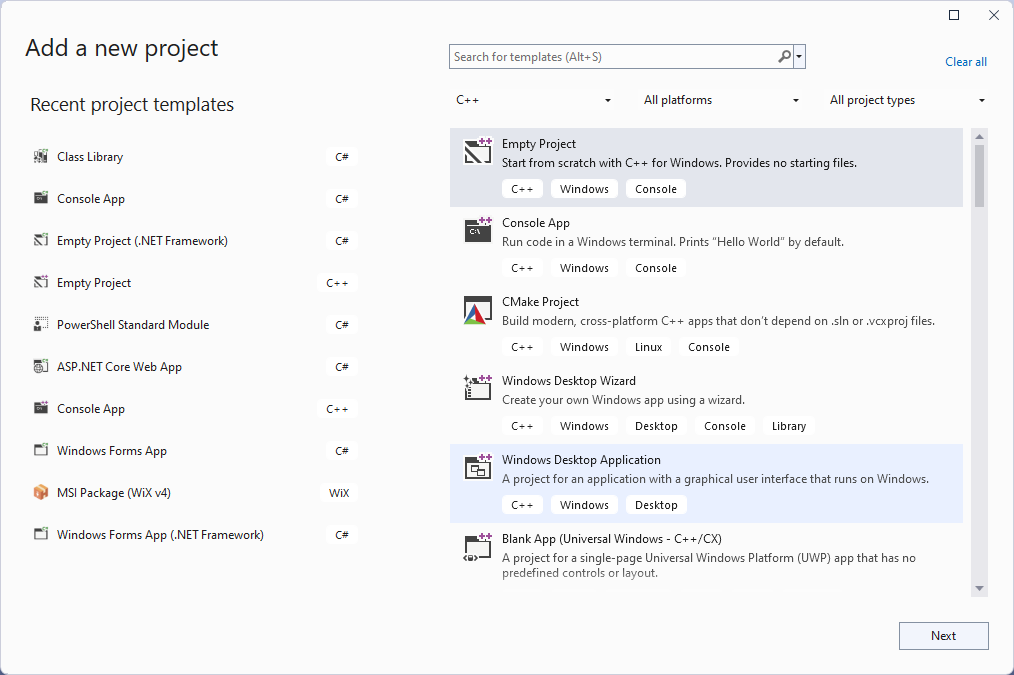
Right-click on the PowerShellDemo solution, navigate to Add, then select New Project.... In the Add a new project dialog, search for "Empty Project", select the template matching C++ for Windows, then click Next:
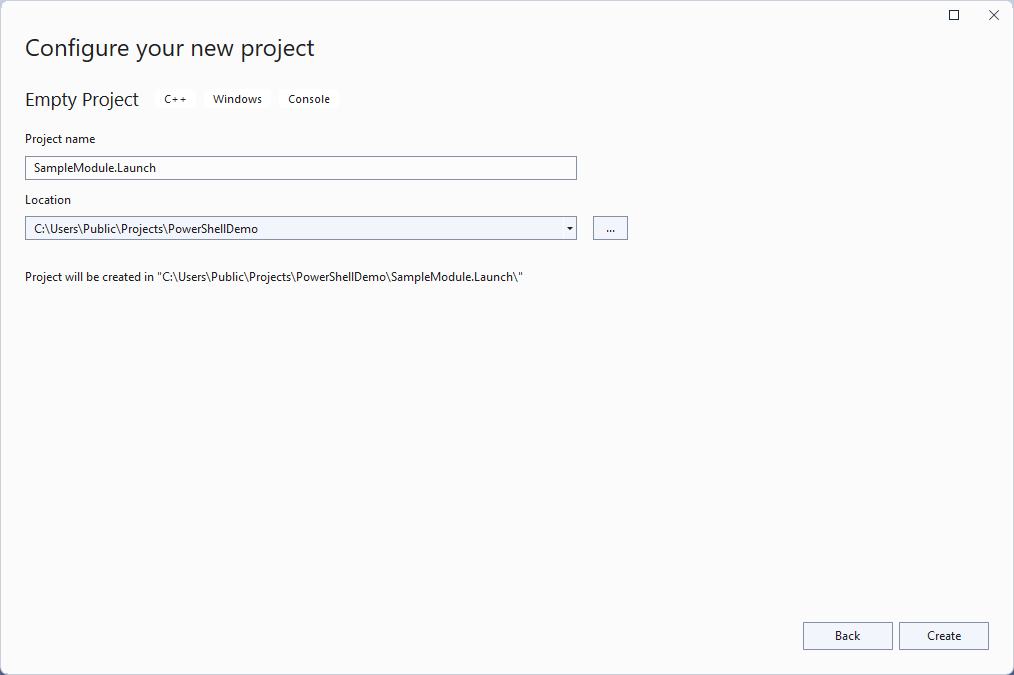
In the Configure your new project dialog, use "SampleModule.Launch" as the project name, then click Create:
Right-click on the SampleModule.Launch project, then select Set as Startup Project.

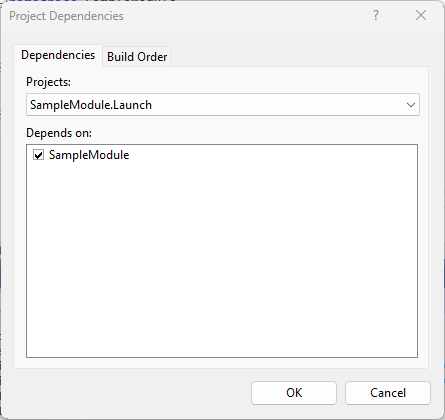
Right-click on the SampleModule.Launch project, then navigate to Build Dependencies, then select Project Dependencies. In the Project Dependencies dialog, under Depends on, select the SampleModule project, then click OK:
Right-click on the SampleModule.Launch project, navigate to Add, then select New Item.... Name the new file "launch.ps1", then set the following contents:
Import-Module "..\SampleModule\bin\Debug\netstandard2.0\SampleModule.dll"
Get-HelloWorld
Right-click on the SampleModule.Launch project, select Properties (it's the last menu item, you can also use the Alt+Enter keyboard shortcut).
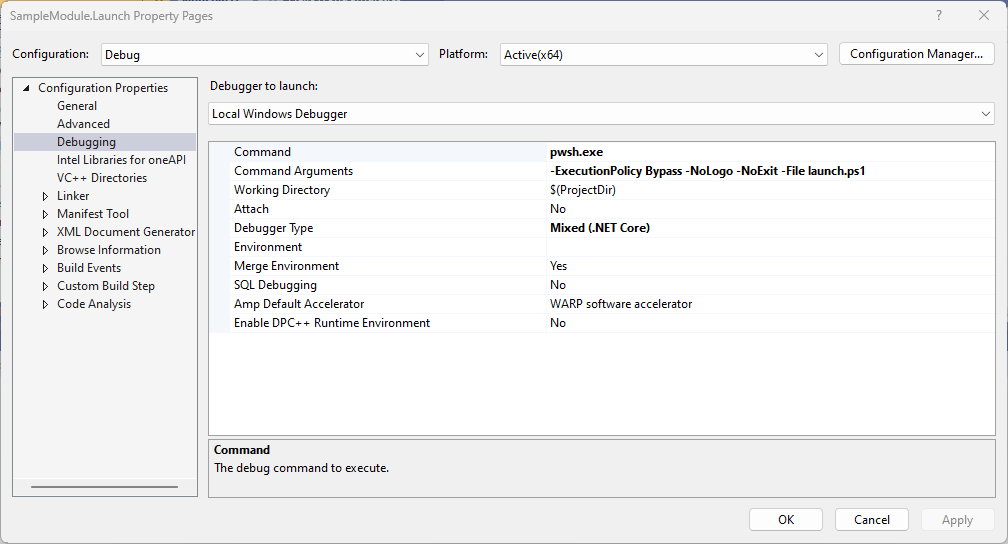
In the Property Pages dialog, navigate to the Debugging section, then change the following:
- Set Command to "pwsh.exe"
- Set Command Arguments to "-ExecutionPolicy Bypass -NoLogo -NoExit -File launch.ps1"
- Set Debugger Type to "Mixed (.NET Core)"
If you want to debug using Windows PowerShell 5.1 (powershell.exe) instead of PowerShell 7 (pwsh.exe), use the following settings instead:
- Set Command to "powershell.exe"
- Set Command Arguments to "-ExecutionPolicy Bypass -NoLogo -NoExit -File launch.ps1"
- Set Debugger Type to "Mixed (.NET Framework)"

Now go back to HelloWorldCmdlet.cs to set a breakpoint on the first line inside the ProcessRecord function of the Get-HelloWorld PowerShell cmdlet:
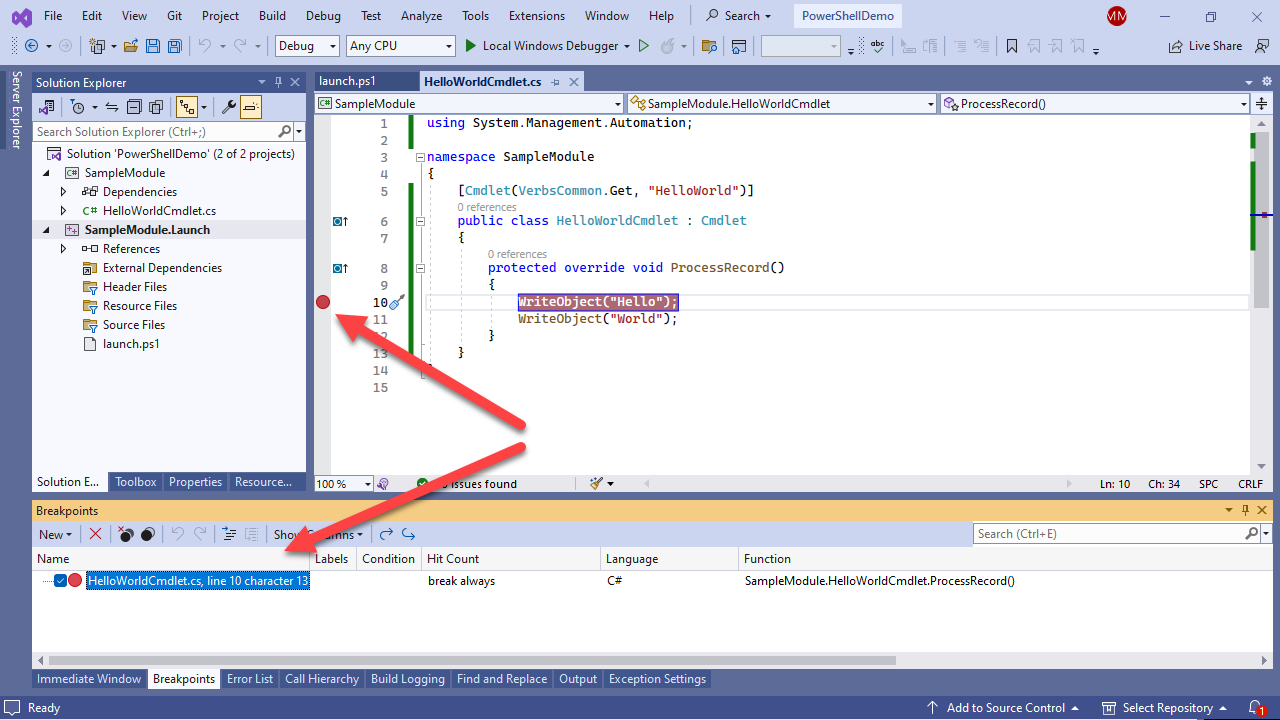
If you've never set a breakpoint in Visual Studio before, all you need is to click in the margin at the left of the line where the red dot appears in the screenshot. You are now ready to give it a try! Press F5 to launch your PowerShell cmdlet in the debugger:
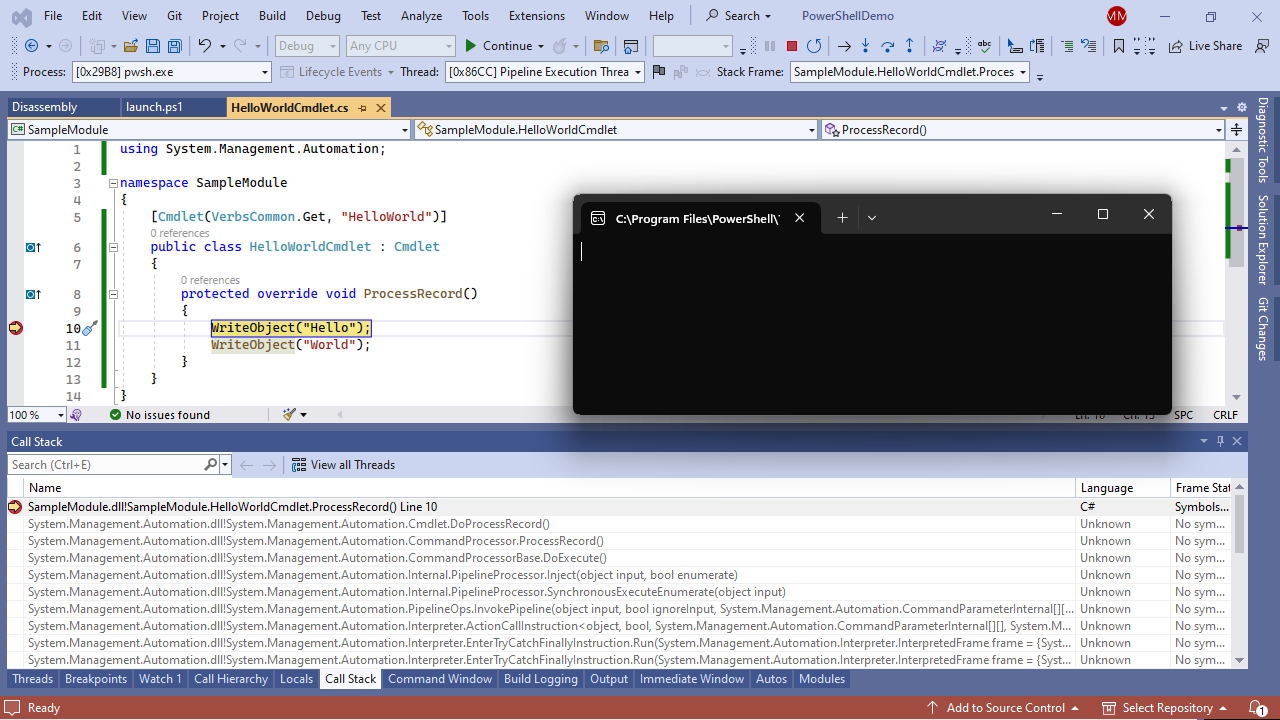
If everything worked, you should see the debugger break on the WriteObject("Hello"); call inside ProcessRecord. If you press F10 or click the Step Over button, the debugger will move to the next line, and you should see "Hello" printed out to the terminal.
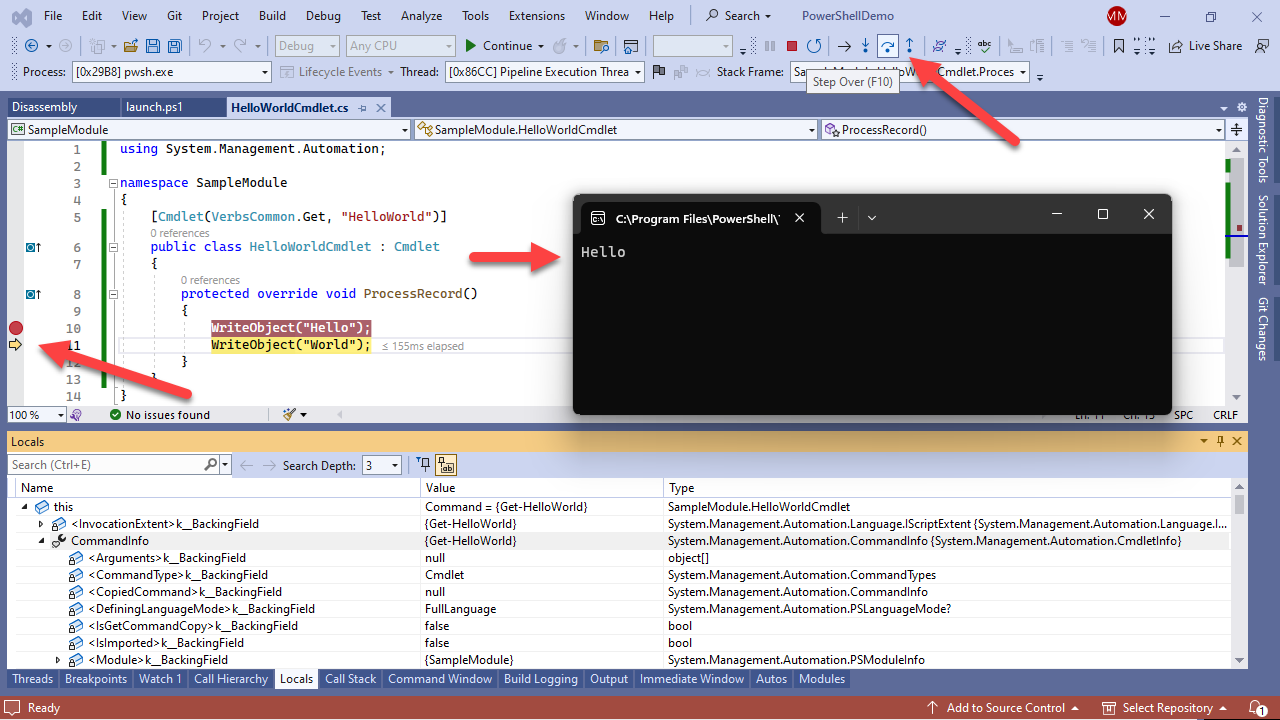
You can also click Continue to resume program execution, which in this case will terminate the program as there's nothing else in our launch.ps1 script after the Get-HelloWorld call.
Remote Debugging
All the steps up to this point cover the basics of local debugging, which is great, but the real deal is remote debugging. Who doesn't want to develop from Visual Studio to automatically deploy and debug PowerShell modules in clean Windows Server virtual machines? Brace yourselves, because the complexity for the second part of this blog post is much higher, but trust me, it's absolutely worth it. For testing, I created a test virtual machine "IT-HELP-DEBUG.ad.it-help.ninja", joined to a test domain "ad.it-help.ninja" in my Hyper-V lab environment, but any standalone Windows virtual machine should be enough.
Remote Debugging Host
In the remote debugging target host, download and install the Remote Tools for Visual Studio. You can automate this part with PowerShell:
$RemoteToolsUrl = "https://aka.ms/vs/17/release/RemoteTools.amd64ret.enu.exe"
Invoke-WebRequest -Uri $RemoteToolsUrl -OutFile "~\Downloads\RemoteTools.exe"
& "~\Downloads\RemoteTools.exe" /install /quiet
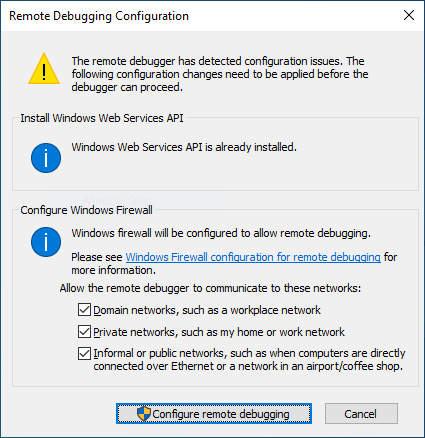
Remove-Item -Path "~\Downloads\RemoteTools.exe"Launch for the first time (msvsmon.exe, or search for "Remote Debugger" in the start menu). In the Remote Debugging Configuration dialog, ensure that all boxes are checked in the Configure Windows Firewall section, then click Configure remote debugging.
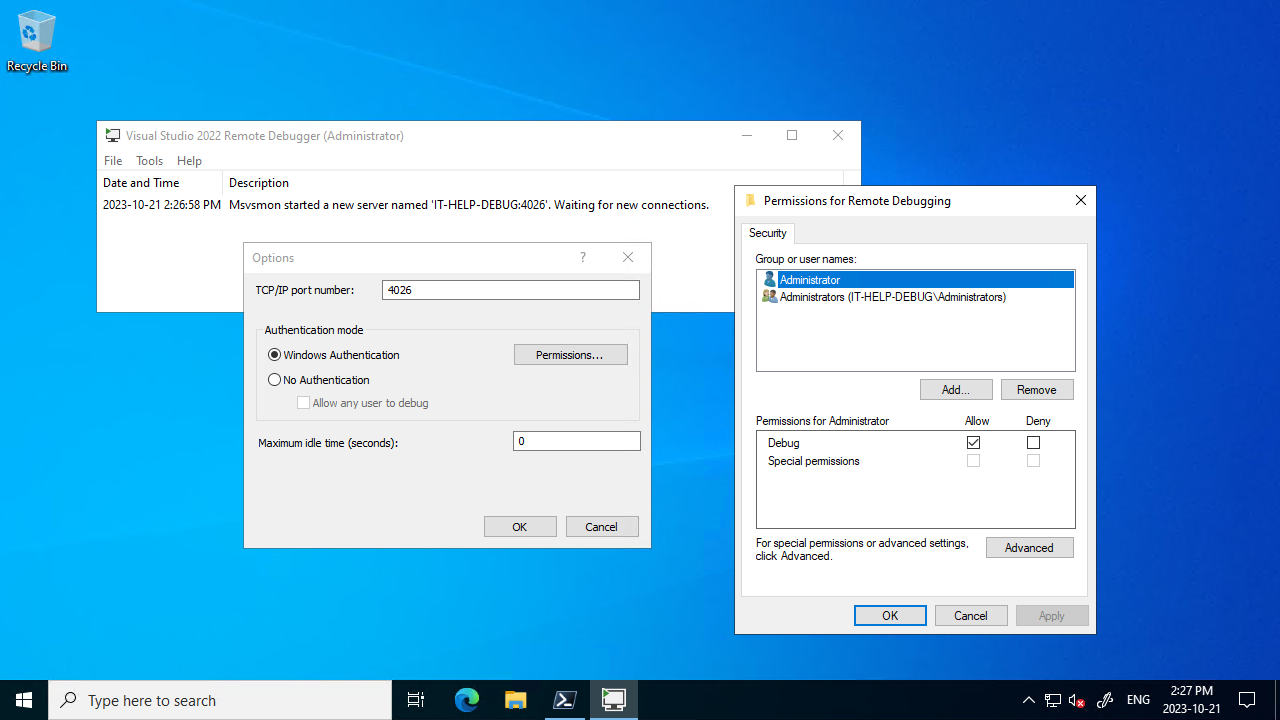
In the Visual Studio Remote Debugger, click Tools, then Options. Leave the default TCP port (4026), and leave Windows Authentication enabled. Click on Permissions to make sure that the user you want to use for remote debugging is allowed:
Remote Debugging Client
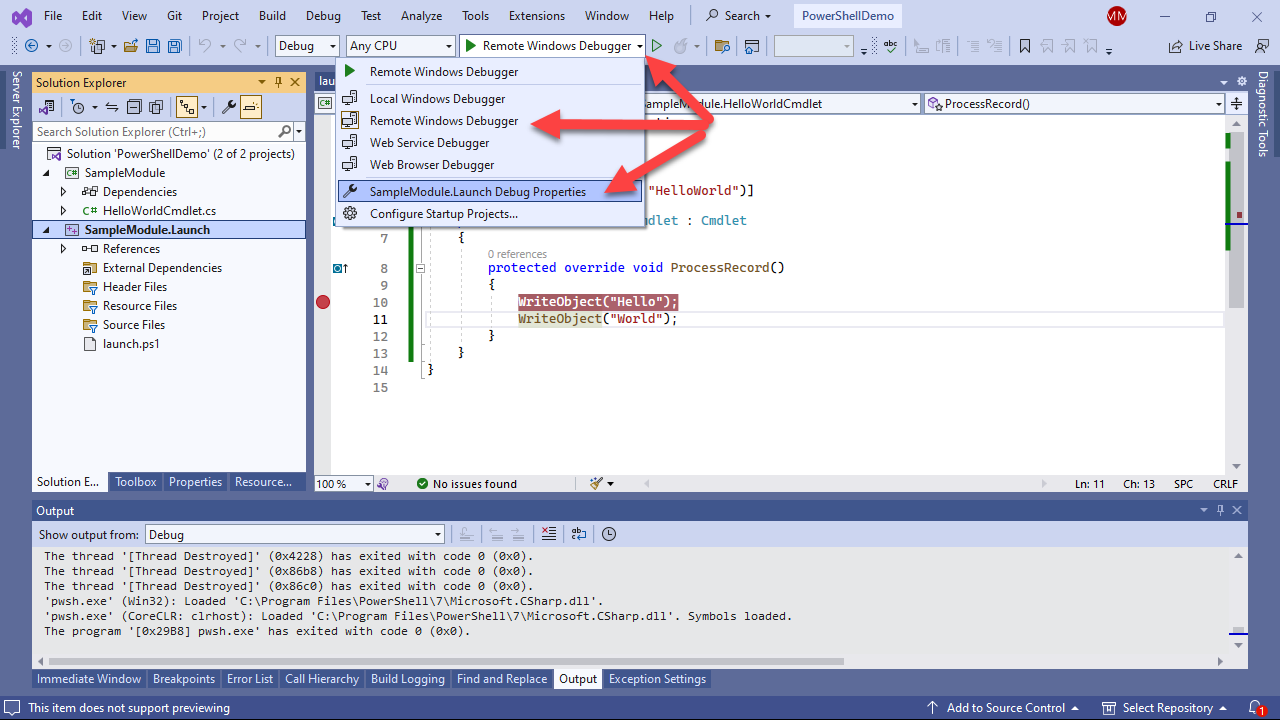
On top of Visual Studio, click on the downward arrow at the right of the active debugger type, revealing a drop-down with other choices. Select Remote Windows Debugger, then select SampleModule.Launch Debug Properties:
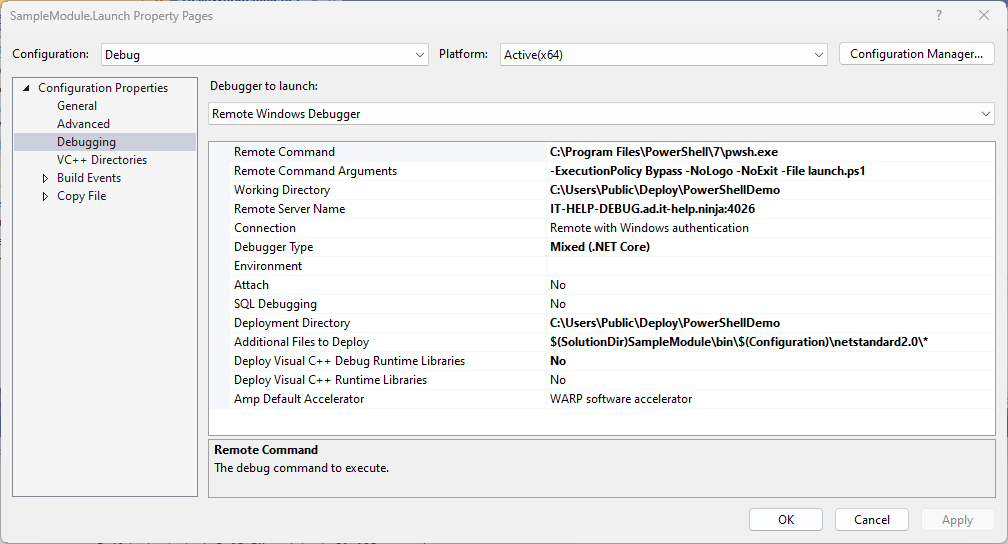
In the Property Pages dialog, navigate to the Debugging section, then change the following:
- Set Command to "C:\Program Files\PowerShell\7\pwsh.exe"
- Set Command Arguments to "-ExecutionPolicy Bypass -NoLogo -NoExit -File launch.ps1"
- Set Working Directory to "C:\Users\Public\Deploy\PowerShellDemo"
- Set Connection to "Remote with Windows Authentication"
- Set Remote Server Name to "IT-HELP-DEBUG.ad.it-help.ninja:4026"
- Set Debugger Type to "Mixed (.NET Core)"
- Set Deployment Directory to "C:\Users\Public\Deploy\PowerShellDemo"
- Set Additional Files to Deploy to "$(SolutionDir)SampleModule\bin$(Configuration)\netstandard2.0*"
- Set Deploy Visual C++ Debug Runtime Libraries to "No"
- Set Deploy Visual C++ Runtime Libraries to "No"
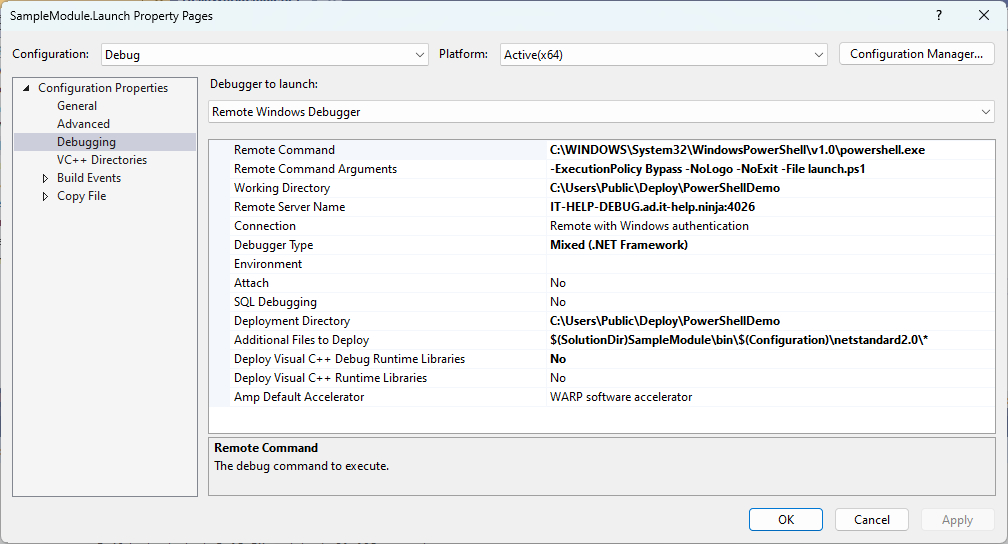
If you want to debug using Windows PowerShell 5.1 (powershell.exe) instead of PowerShell 7 (pwsh.exe) change the following:
- Set Command to "C:\WINDOWS\System32\WindowsPowerShell\v1.0\powershell.exe"
- Set Debugger Type to "Mixed (.NET Framework)"
You may notice that we're using absolute file paths to the remote executable: unfortunately, this a limitation of the remote debugger.
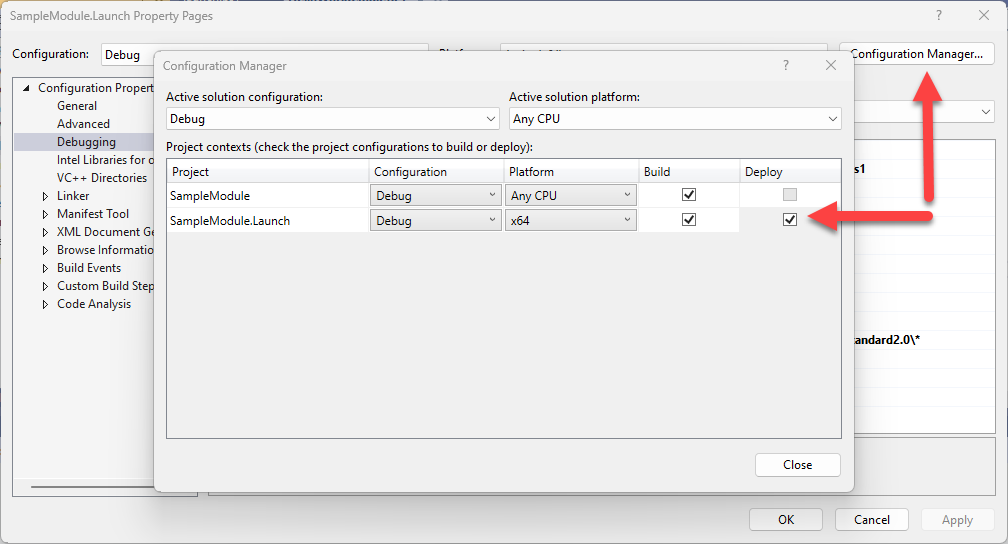
Click on Configuration Manager at the top-right of the current dialog, then enable Deploy for the SampleModule.Launch project:
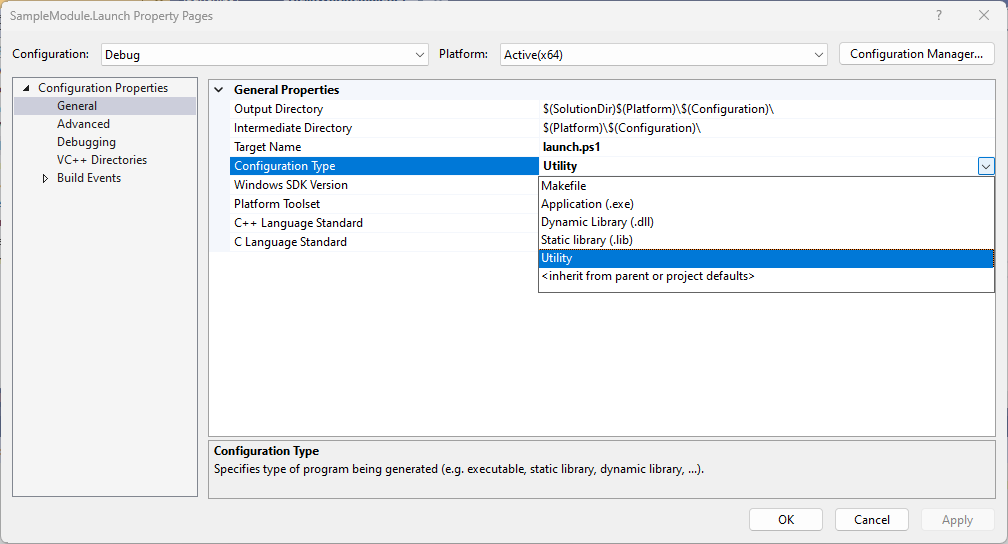
Navigate to the General section under Configuration Properties, then change the following:
- Set Target Name to "launch.ps1"
- Set Configuration Type to "Utility"
You can now close the SampleModule.Launch properties dialog.
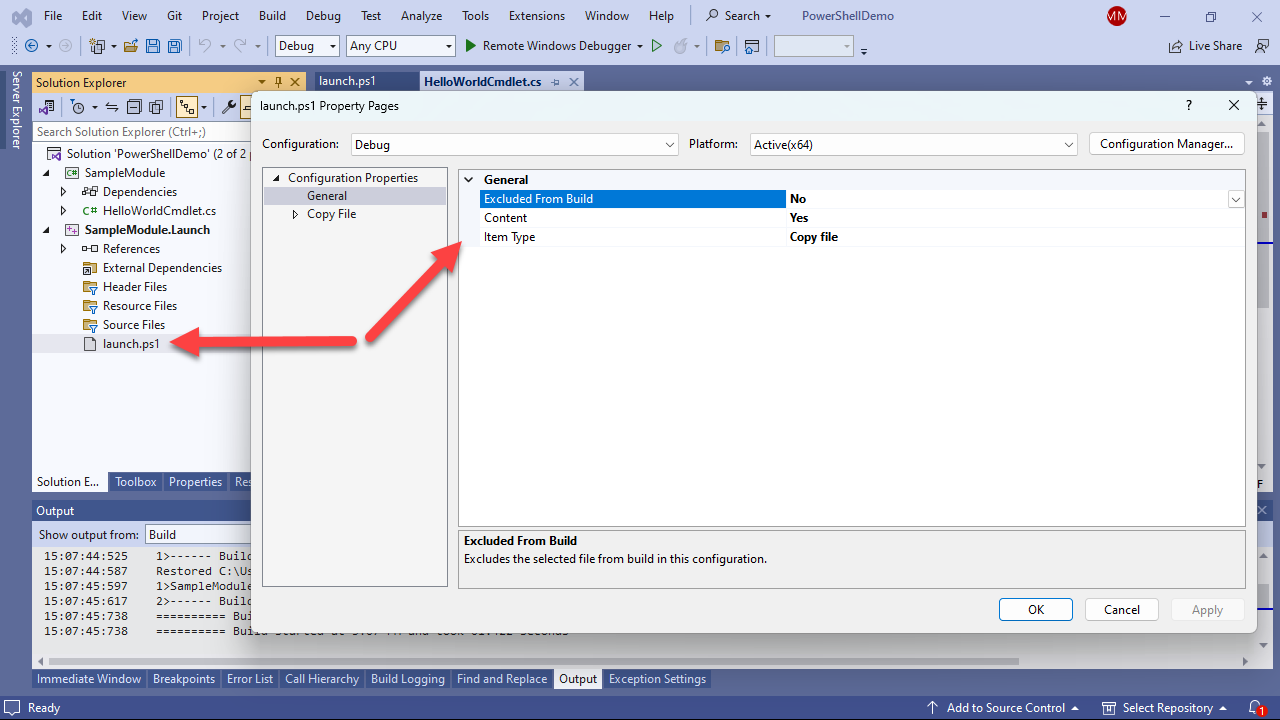
Next, right-click on launch.ps1 and select Properties and navigate to the General section to make the following changes:
- Set Excluded From Build to "No"
- Set Content to "Yes"
- Set Item Type to "Copy File"
Update launch.ps1 with the following code (launch.ps1 is now remotely deployed in the same directory as the binary PowerShell module):
Import-Module ".\SampleModule.dll"
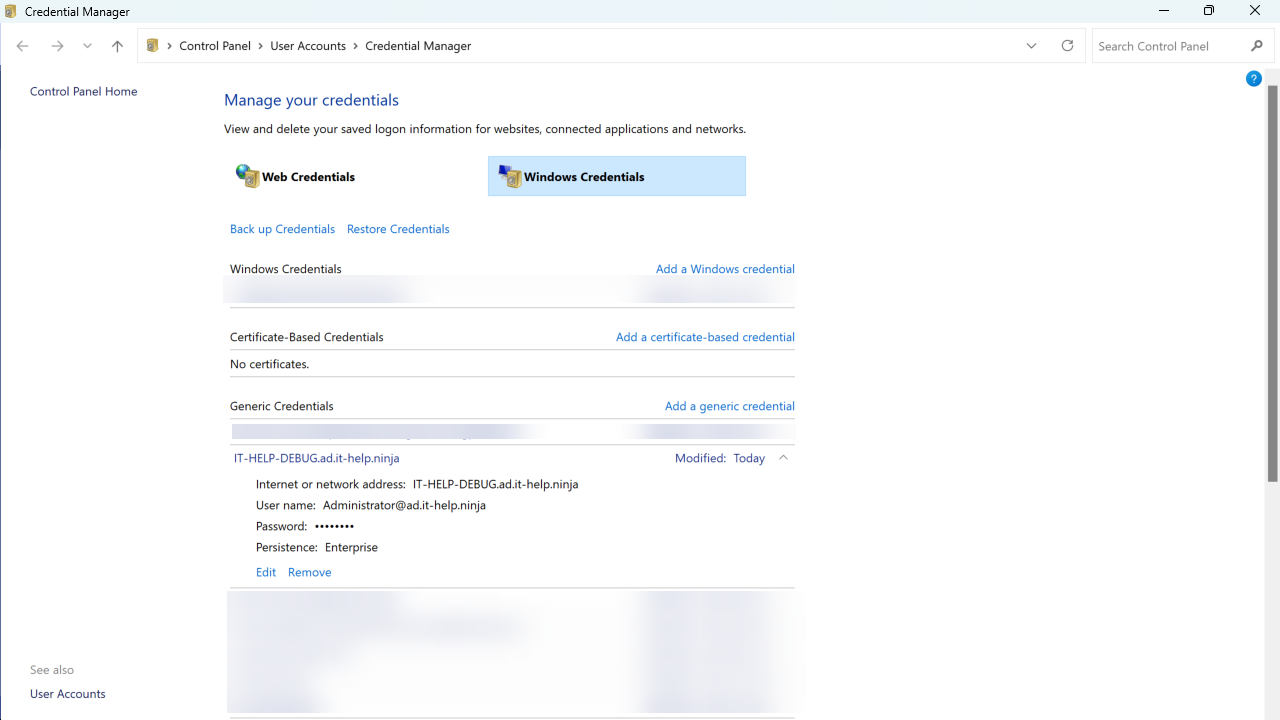
Get-HelloWorldTo avoid getting prompted for credentials, you can save them in the Windows credential manager like this:
$TargetHost = "IT-HELP-DEBUG.ad.it-help.ninja"
$UserName = "Administrator@ad.it-help.ninja"
$Password = "DevoLabs123!"
$securePassword = ConvertTo-SecureString $Password -AsPlainText -Force
cmdkey /generic:$TargetHost /user:$UserName /pass:$SecurePassword
You can then delete the credentials from the Windows credential manager later:
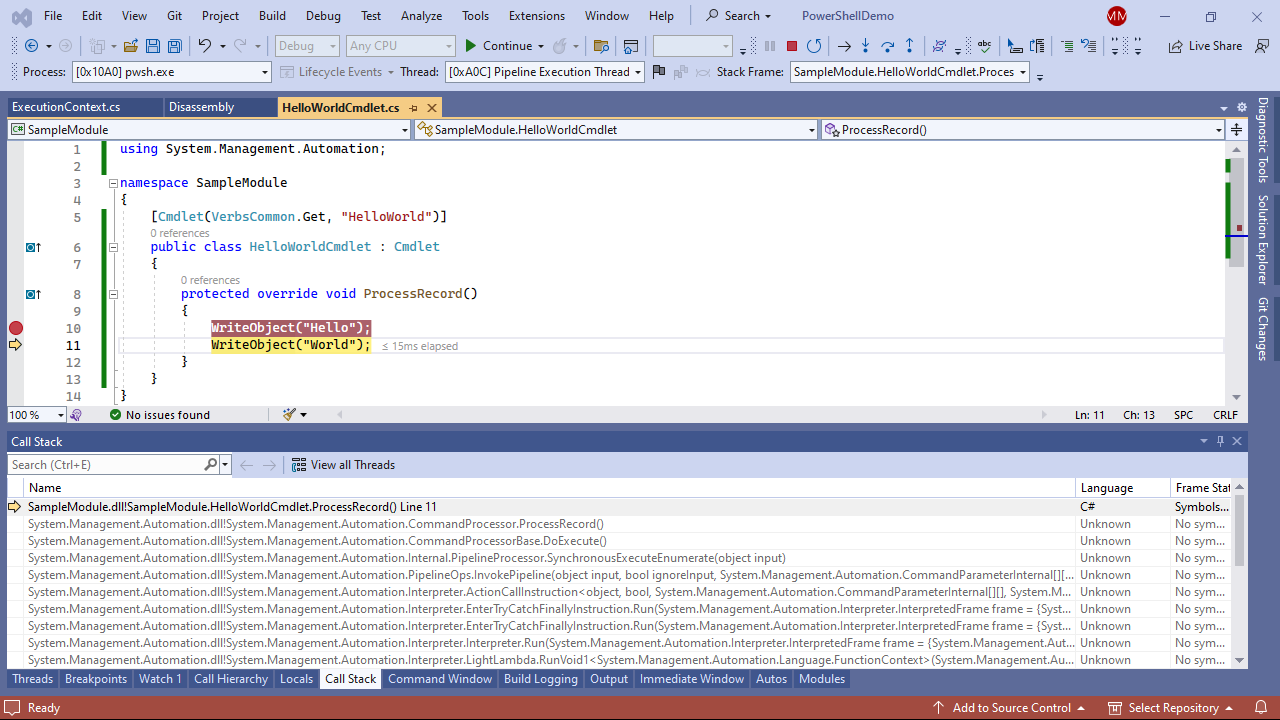
You are now ready to finally press F5 to remotely deploy and debug your PowerShell binary module. If everything worked, you should get prompted for credentials (if you haven't saved them locally), then after a lot of symbol loading, you will finally hit the breakpoint in Visual Studio:
In the remote debugging target host, the Visual Studio Remote Debugger dialog should show a log entry for the connection. If there isn't one, it means the client isn't connecting. Make sure the Remote Server Name configured previously is set to the correct hostname and port ("IT-HELP-DEBUG.ad.it-help.ninja:4026" in my case, but you need to change it to point to your target host). If it still doesn't work, make sure that the firewall is not blocking the connection.
In the success case, you should now see the PowerShell terminal in the target host with our sample PowerShell binary module loaded in the remote debugger:
Congratulations, you can now develop locally, yet remotely deploy and debug an up-to-date copy of your development build just by pressing F5 in Visual Studio! This is so much better than manually copying files over to the remote machine, which is error-prone, and often results in mismatches between local sources and remote binaries. The functionality is already there, but it is difficult to use, with too many repeated steps that could be automated.
Remote Deployment and Debugging over Remote Development?
A popular trend these days is VSCode remote development, which most often consists of installing tools in a remote host to present the user interface locally. This is better than connecting to a Windows VM over RDP to run Visual Studio "remotely", as a local user interface is more responsive, especially for typing text. However, the actual development tools still run 100% remotely, meaning you're still doing local debugging, but with a remote user interface. The source code is also built from the remote host, rather than built locally to deploy only the resulting build artifacts. This may be great for use cases like Microsoft Dev Box where you get a powerful build machine in the cloud, but it doesn't solve the issue of code deployment and execution in clean environments separate from the development environment.
With remote deployment and debugging, we could stop building and debugging on the same host: we could cross-compile and debug to all targets from a single development environment. If this is obvious for mobile development to Android or iOS targets, why isn't isn't this the norm yet for desktop application development? It's now possible to debug Linux applications from Visual Studio using WSL, but there's no simplified equivalent for Windows targets! Remote development solves a problem by making it easier to develop on remote hosts, but it doesn't make it easier to keep a single development environment from which you can develop for all targets at once. If you work in the Visual Studio team at Microsoft, I have a LOT of feedback to give on how these kinds of workflows could be improved.