MSBuild Binary Logs Reveal What Visual Studio Hides
If you've ever tried to diagnose slow .NET builds in Visual Studio, you already know the pain: even if you crank the build verbosity to Diagnostic, all you get is a firehose of interleaved, noisy text that describes what happened without the why and how. Your life feels like a Coldplay song:
🎶 When you try your best, but you don't succeed 🎵 When you get what you want, but not what you need 🎶
What do we want? Build logs. What do we need? Build insight.
Want to know where your build time actually went? Which analyzer or generator slowed everything down? Why a project got rebuilt when it shouldn't have? Forget it. Visual Studio won't tell you.
The irony is that MSBuild has had the answer for years: binary logs. Compact, structured, and infinitely more useful than anything in the Output Window. They capture everything that happens during your build, and with the right viewer, they make diagnosing performance issues almost pleasant.
This post shows you how to break free: capture your own binary logs, explore them with msbuildlog.com, and finally see the truth behind your builds.
Step 1: Install the Viewer
You'll need a way to read .binlog files. Install the MSBuild Structured Log Viewer:
winget install KirillOsenkov.MSBuildStructuredLogViewer
Step 2: Enter a Developer Shell
Open PowerShell, then move to the directory where your .sln file is located. You will need a Visual Studio developer shell to use the msbuild command. Instead of launching a new Visual Studio shell in a special way, you can use the VsDevShell PowerShell module to do it from an existing shell easily:
Install-Module VsDevShell -Scope CurrentUser
Enter-VsDevShell
You can also use the dotnet build command which doesn't require a Visual Studio developer shell, but it is possible that your solution won't build, especially if it has a lot of .NET legacy components.
Step 3: Capture a Binary Log
Build your solution at the command-line with the /bl /p:ReportAnalyzer=true parameters:
msbuild .\YourAwesomeApp.sln /bl /p:ReportAnalyzer=true
dotnet build .\YourAwesomeApp.sln /bl /p:ReportAnalyzer=true
You'll get msbuild.binlog in the current working directory. In order to get insight into Roslyn code analyzers, you'll want to make sure they're enabled at build time.
Step 4: Actually Learn Something
Open msbuild.binlog in the viewer and you'll finally see:
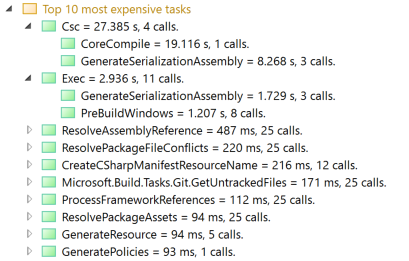
Top 10 most expensive tasks → figure out where most of the build time went (beyond just "building stuff"):
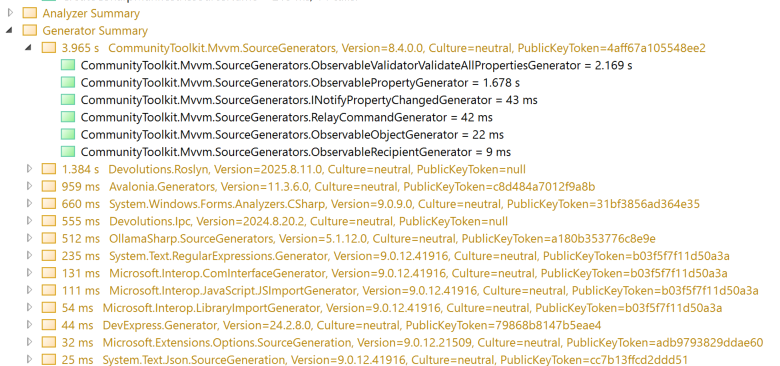
Analyzer and generator summary → spot costly Roslyn code analyzers and source generators instantly:
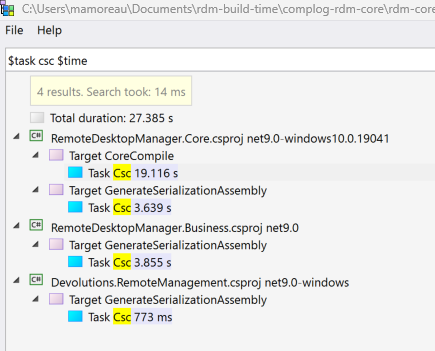
Search → run queries like $task csc $time to see core compiler cost, among other things.
Instead of scrolling endlessly through useless text, you'll have real, detailed insight that you can investigate properly.
Roslyn Code Analyzers
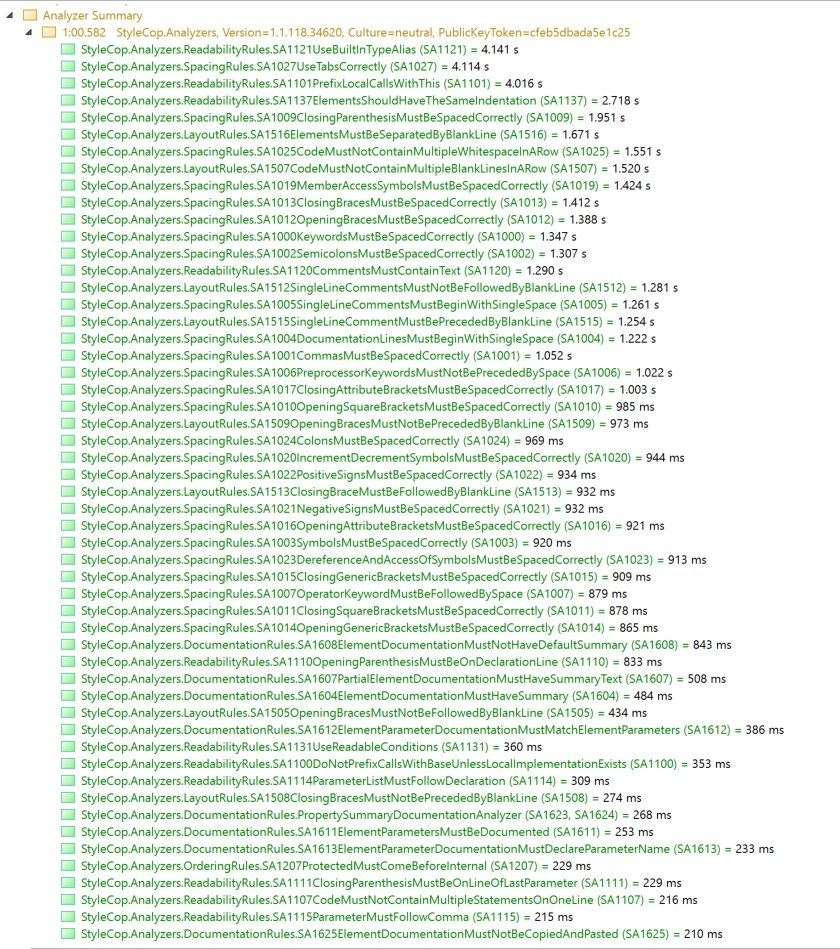
Roslyn code analyzers are a common cause of Visual Studio eating all the RAM and CPU until your $5,000 laptop feels like a $500 model. Seriously, here's a screenshot from 2023 showing StyleCop costing an entire minute of code analysis:
And before StyleCop, we had been bitten by SecurityCodeScan that was taking 90 seconds for something we certainly didn't need to run on every build.
Take the time to capture logs with code analyzers enabled, as they can be horribly expensive to run continuously. Review your project settings to control when they run, and the scope of analysis.
Roslyn Source Generators
The first time I heard about Roslyn source generators, I was a bit skeptical. If it's too convenient to generate source code during the build, what will prevent it from becoming a trap for build performance?
It turns out my intuition was confirmed when someone sent me a screenshot of their own build log with 90 seconds spent in WinRT.SourceGenerator. The other Roslyn source generators would bring the total generation time to a whopping two minutes.
Just this year, a bug in the .NET SDK unexpectedly enabled WinRT source generators we didn't use, adding 30 seconds to our builds.
As if it wasn't enough, a few months later, a bug in the .NET Azure SDK accidentally enabled the System.ClientModel source generator, adding 60 seconds to our builds, but also increasing RAM usage in Visual Studio by 8GB.
How many other developers out there have come to accept such poor build performance as the norm? This is becoming a recurring problem that can't easily be fixed by buying better hardware.
Capturing Design-Time Builds
If you suspect performance issues that happen while using Visual Studio, there's a good chance design-time builds are responsible. In order to capture those logs, you'll have to launch Visual Studio (devenv.exe) from the command-line with environment variables:
$Env:MSBuildDebugEngine="1"
$Env:MSBUILDDEBUGPATH="$Env:LocalAppData\Microsoft\IDE\MSBuildDebug"
& devenv.exe
If devenv.exe cannot be found, make sure you are inside a developer shell. Once Visual Studio starts, open your project, build it and then close it. Collect the log files under %LocalAppData%\Microsoft\IDE\MSBuildDebug for analysis.
Unfortunately, when collecting logs this way, you will get a lot of individual .binlog files. This is because Visual Studio spawns multiple processes for the different builds it launches (design-time or not).
Capturing Command-Line Arguments
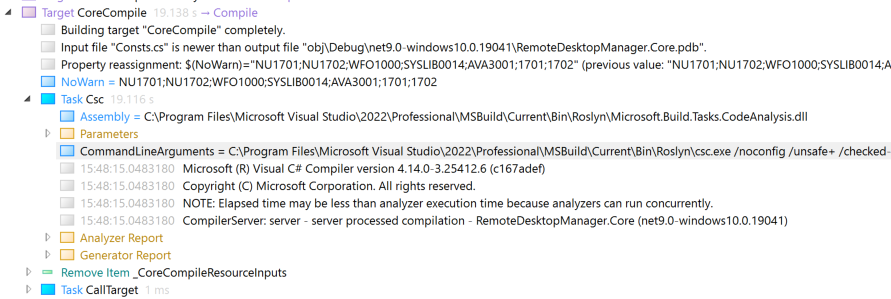
Under a CoreCompile target, you'll find a Csc task. Expand it, then double-click on CommandLineArguments. The entire csc.exe command-line will be shown on the right-hand side:
Alternatively, you can log Roslyn (csc.exe) command-lines to files using the RoslynCommandLineLogFile environment variable:
$Env:RoslynCommandLineLogFile = "$Env:LocalAppData\Microsoft\IDE\RoslynCommandLineLogs"
mkdir $Env:RoslynCommandLineLogFile
& devenv.exe
Make sure the directory you're pointing to already exists, otherwise the logs won't get created. The format is slightly different, but in both cases, you can copy the command-line parameters to a .rsp file which can be passed to csc.exe manually, like this:
& "csc.exe" /noconfig '@D:\dev\build.rsp'
Just remember that /noconfig cannot be inside the .rsp file, and that csc.exe commands need to be executed from the directory where the .csproj file is located.
Why Doesn't Visual Studio Show This?
This is the frustrating part: msbuild binary logs aren't new. They are incredibly useful, yet they have never been properly exposed as a built-in feature of the Visual Studio IDE. For the vast majority of Visual Studio users, if it's not in the GUI, it might as well not exist at all.
Yes, Visual Studio 2026 Insiders feels snappier, but that's mostly on the surface.
Loading projects faster into my solution isn't going to help me figure out why the projects I have to build are rebuilt when they shouldn't, or where the build time is spent.
Would you believe me if I told you that we only recently figured out at Devolutions that a whole 8 seconds of build time was caused by 300,000 lines of constantly regenerated XML serializer code that was always rebuilt from source, even if the corresponding project was skipped for building?
You can't fix what you cannot know is broken in the first place!
Closing Thoughts
Next time your build feels slow, don't guess. Capture a binary log, open it, and see what happens for real. Make changes, rinse and repeat.
If you're in the Visual Studio team, I have one request for you: please implement msbuild binary logging directly inside Visual Studio as a first-class feature. This would be by far the most significant improvement of the last decade in Visual Studio for .NET developers.